
Getting Started: Custom Filters for the Data Forwarder
Summary
Carbon Black Cloud’s EDR capabilities provide SOCs with unfiltered endpoint event data, critical in detection and incident response use cases. The Data Forwarder can stream endpoint events to third party solutions such as XDR, SIEM, and Data Lake. Unfortunately, many solutions cannot scale to meet the demands of unfiltered EDR or are prohibitively expensive to do so.
Carbon Black Cloud now has powerful filtering capabilities, putting you in control of the data your organization finds most valuable, while meeting your team’s data budget. This guide is a framework to help identify the most valuable use cases to your organization and the filters that can drive them. The content is primarily targeted at customers with Enterprise EDR enabled, as customers with only Endpoint Standard generally experience low enough event volume (~1% of EDR data) that only minimal filtering is necessary.
Getting Started
Pre-Requisites
The data and filters available to you will vary based on the products you’ve purchased.
| Endpoint Standard | Enterprise EDR | Both |
|---|---|---|
|
Endpoint Standard includes Behavioral EDR, a subset of all EDR intended to compliment Endpoint Standard’s NGAV offering. The data volume is usually a small fraction of unfiltered EDR, so many of the recommendations below are targeted at customers with Enterprise EDR or Endpoint Standard + Enterprise EDR. |
Enterprise EDR includes unfiltered EDR event data. Data collected includes but is not limited to: Filemods, Regmods, Netconns, Modloads, Binary, Process etc. |
With the full suite of Carbon Black Cloud products you can take full advantage of both data streams and will be able to use all the recommendations available in this guide. For example, you can use the unfiltered EDR events for lower volume, high value events while using the curated Behavioral EDR events for higher volume event types. |
To determine which product you have access to in the Carbon Black Cloud console click your username in the upper-right corner. Enabled products will have the “ENABLED” tag.

Budgeting for Data Consumption
If you’re looking to filter data, odds are you are on a data budget.
First, identify what that budget is.
You can use this guide to identify the highest value data within that budget, and make the case for increasing the budget if you discover high value data beyond it.
Estimate Disclaimer
The estimates in this guide are per endpoint, based on weekday averages across Carbon Black Cloud as of December, 2022. They will vary significantly customer-to-customer based on what applications are running on the endpoint. These numbers are intended as a guide only.
While estimates in this guide are for volume in terms of bytes, customers looking for estimates of count (e,g, messages or events per second) can assume events to be roughly 2 KB each.
|
Average Weekday Carbon Black Cloud Data Forwarder Data Volumes Per Endpoint Per Day |
||||||
|
|
Behavioral EDR (Endpoint Standard)
|
Unfiltered EDR (Enterprise EDR)
|
||||
|
Event Type |
Windows |
Mac |
Linux |
Windows |
Mac |
Linux |
|
|
4.2 MB |
0.1 MB |
N/A |
3.3 MB |
N/A |
N/A |
|
|
0.1 MB |
N/A |
N/A |
25 MB |
0.1 MB |
N/A |
|
|
1.1 MB |
N/A |
N/A |
4.0 MB |
N/A |
N/A |
|
|
1.3 MB |
1.1 MB |
2.5 MB |
233 MB |
256 MB |
118 MB |
|
|
0.2 MB |
N/A |
N/A |
214 MB |
15 MB |
N/A |
|
|
3.0 MB |
5.1 MB |
N/A |
41 MB |
74 MB |
77 MB |
|
|
N/A |
N/A |
N/A |
13 MB |
72 MB |
0.8 MB |
|
|
3.1 MB |
2.4 MB |
103 MB |
12 MB |
75 MB |
53 MB |
|
|
0.1 MB |
N/A |
N/A |
143 MB |
N/A |
N/A |
|
|
0.1 MB |
0.5 MB |
N/A |
10 MB |
0.4 MB |
313 MB |
|
Totals |
11.6 MB |
8.1 MB |
105 MB |
695 MB |
451 MB |
543 MB |
Estimating AWS costs
In AWS, you’ll pay for the cost of the compressed data for both storage and sending data out of AWS to your downstream solution. Endpoint Events compress very effectively, so compression ratios are generally 90% or better. Your AWS may incur additional charges if your architecture differs from the example.
- AWS Costs Estimation Example
-
A US-based Enterprise EDR customer with 1,000 endpoints who is forwarding
procstart(12 MB per endpoint per day) andnetconn(41 MB per endpoint per day) events to AWS.- Storage in us-east-1: 30 days of storage at $0.023 per GB per month
- (1000 endpoints) * (12 MB + 41 MB per endpoint per day) * (90% compression ratio: 0.1) * 30 days = 155 GB per month
- $0.023 per GB per month * 141 GB = $3.57 per month
- Data Transfer to OUT from S3 to internet (your SIEM): $0.09 per GB
- $0.09 per GB * 155 GB = $13.95 per month
- S3 Event Notification to SQS: The best practice of reliably getting data from S3 to a downstream solution at $0.40 per 1M requests
- ~100,000 requests per day * $0.40 per 1M requests = $1.20 per month
Total: $18.72 per month
- Storage in us-east-1: 30 days of storage at $0.023 per GB per month
- Estimating Alert Data Volume
-
While this article is primarily focused on endpoint event filtering, customers commonly ask "how much alert volume should I expect from a Data Forwarder of type Alert?"
This section should convince you that alert volume is typically orders of magnitude less than endpoint event volume. Alerts currently can't be filtered, but filtering may be available in the future.
The best way to estimate your own alert volume is from the Carbon Black Cloud console's Alerts page!
- Clear all filters from the lefthand pane
- Under Priority: Set Target value to "Low" and the severity filter to 1+
- Under Workflow: Select "Not Dismissed" and "Dismissed"
- Under Other Activity: Select "Observed"
- Ensure "Group alerts" in the upper-right is "Off"
- Divide the final result count by the number of days in your search timeframe
- For best results, use at least 2 weeks.
If you don't have access to these numbers yet, I'll provide estimates in the form of percentiles. P95 means 95% of customers have fewer than this number of alerts per endpoint per day.
P95, alerts per endpoint per day Endpoint Standard (CB Analytics alerts) 8 * Enterprise EDR (Watchlist alerts) 7 * One final consideration! An updated copy of CB Analytics alerts is forwarded any time Carbon Black Cloud learns more about the alert. The alert
idfield will stay constant, but information such as the severity, primary process, or description may update. While the number of copies varies depending on the nature of the threat, on average you may see 10 or more updates to an alert.Example calculation for a 10,000 endpoint Endpoint Enterprise customer:
- CB Analytics: (8 alerts per endpoint per day) * (10 updates per alert) * (10,000 endpoints) * (2.8 KB per alert) = 2.24 GB per day, uncompressed
- Watchlist: (7 alerts per endpoint per day) * (10,000 endpoints) * (2.4 KB per alert) = 168 MB per day, uncompressed
- Total: 2.4 GB per day, uncompressed
AWS size & cost varies slightly with endpoint events; alerts are batched more frequently to get them to you faster, but that brings compression down a bit to 80%+.
- AWS Sizing: (2.4 GB per day) * (30 days) * (80% compression ratio: 0.2) = 14.5 GB per month, compressed
- AWS Cost: ~$2.80 per month (see AWS Costs Example above for the math)
Side-note: Don't be afraid of that 8-alerts-per-endpoint-per-day figure! The average customer has fewer than 0.003 high-severity, actionable alerts per endpoint per day. The remainder of those alerts (the other 7.997) are a valuable curated data set for context, threat hunting, and proactive response.
The Data Forwarder includes all CB Analytics alerts, both "Threat" and "Observed".
- Threat alerts are actionable intelligence, accounting for a small percentage of all CB Analytics Alerts. The Data Forwarder tags them with
category = WARNING.- These are the alerts you see by default in the Carbon Black Cloud console's Alert page.
- Observed alerts are contextual clues, such as possible reconnaissance behavior. The Data Forwarder tags them with
category = NOTICE.- You can view these alerts in the Carbon Black Cloud console's Alert page by including "Observed" in the "Other Activity" filter on the left filters pane.
- Clear all filters from the lefthand pane
- Estimating Watchlist Hit Volume
-
Carbon Black Cloud added Watchlist Hit forwarding in December 2021 for Enterprise EDR customers. This new Data Forwarder type contains all watchlist hits, alerted and non-alerted. The data powers incredibly useful content and context about the watchlist hit. You can find examples of what's possible, such as threat hunting with MITRE, in the Useful Queries for the VMware Carbon Black Cloud Splunk App article.
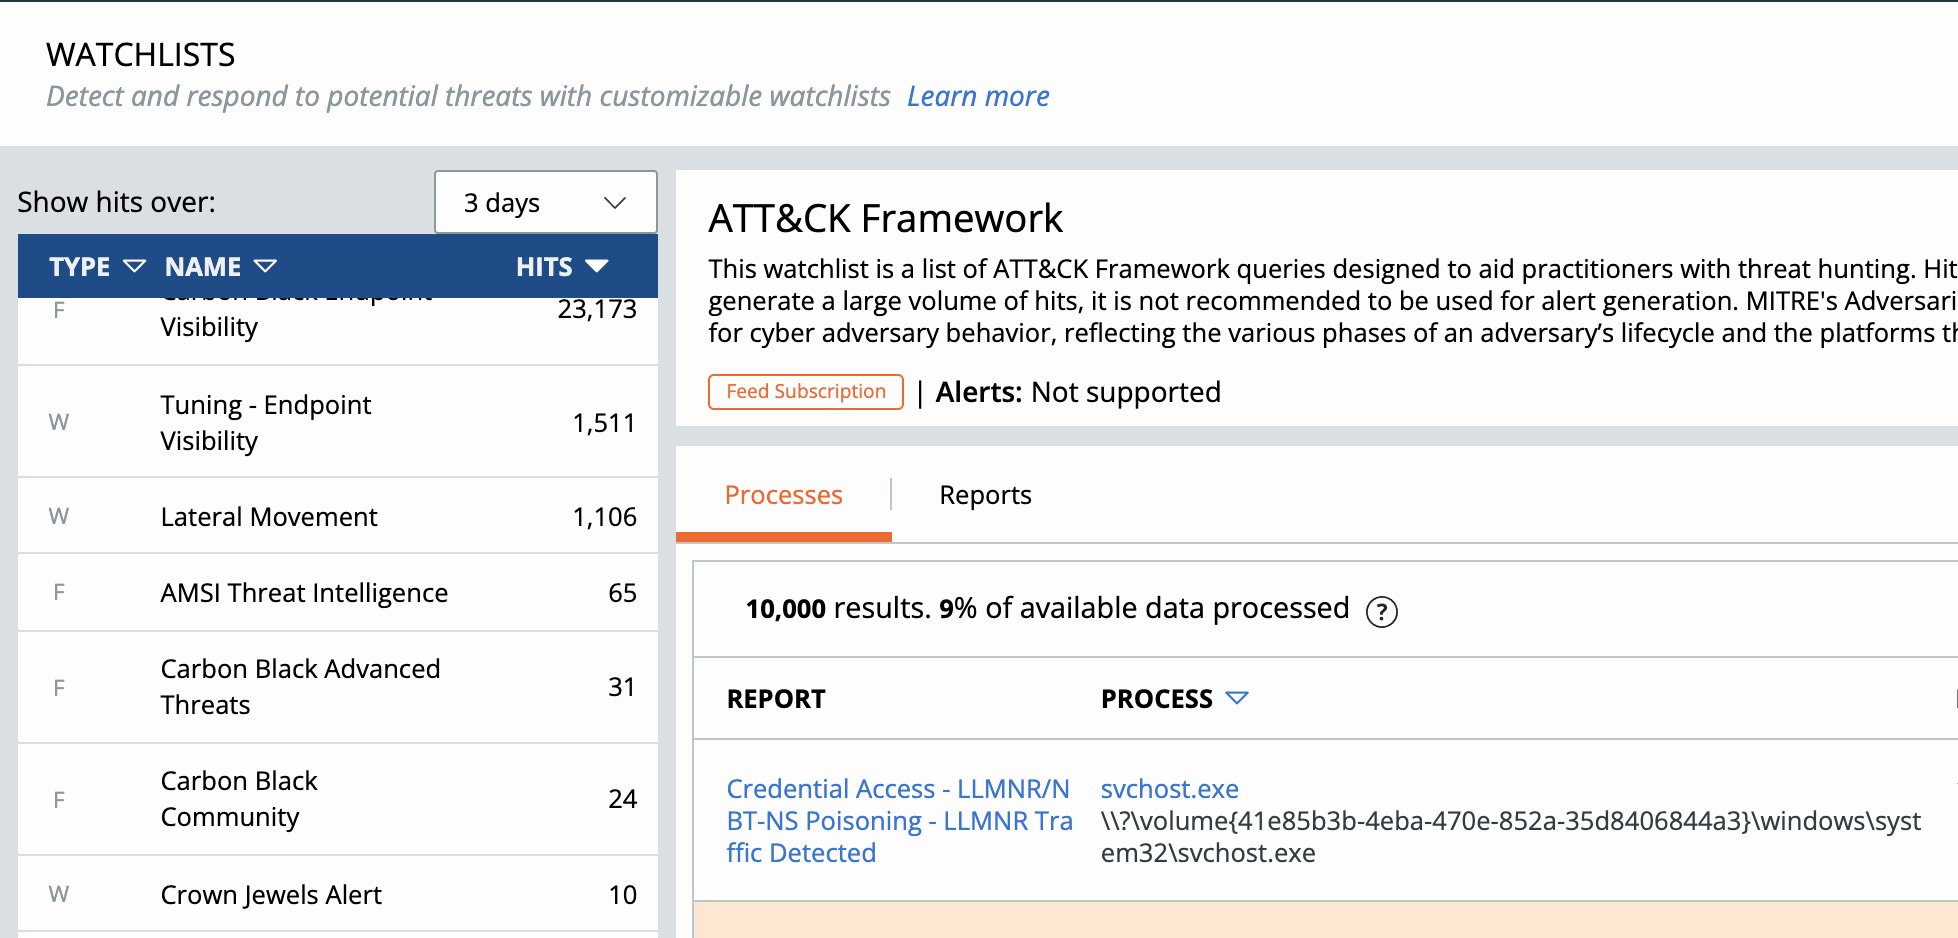
The best place to estimate your Watchlist Hit data volume is the Carbon Black Cloud console, from the Enforce → Watchlists page.
- Select at least "1 week" in the time selector above the list of watchlists to the left.
- Sort by "Hits", then sum up the hit counts and divide by the timespan to get a daily average hit count.
Like with the alerts estimation above, if you don't have access to this information in your environment, we'll use the P95 of 1,700 hits per endpoint per day for the calculation.
Example calculation for a 10,000 endpoint Enterprise EDR customer:
- Watchlist Hits: (1,700 hits per endpoint per day) * (10,000 endpoints) * (2.1 KB per alert) = 36 GB per day, uncompressed
- AWS Sizing: (36 GB per day) * (30 days) * (85% compression ratio: 0.15) = 160 GB per month, compressed
- AWS Cost: ~$19.35 per month (see AWS Costs Example above for the math)
Watchlist Hits are a great place to start if you aren't sure what data to forward. Carbon Black Cloud has nearly a thousand out-of-the-box watchlist reports help identify the most interesting and important behavior, narrowing down an endpoint's daily 800+ MB to around 4 MB.
Top Customer Use Cases
Customers filter data for a variety of reasons in order to achieve desired results. Your approach will depend on what use cases you’re looking to achieve downstream. Run through the below use cases to get ideas for how other customers have leveraged the filtration.
Alert Triage
A popular use of the Data Forwarder is to enable triage of Carbon Black Cloud alerts in a downstream tool such as a SIEM.
Having NGAV and EDR alerts as part of your single-pane-of-glass can facilitate more effective SOC workflows.
Create an Alerts Forwarder
Navigate to Settings > Data Forwarder, then select 'Add Forwarder'.
Create a forwarder of type “Alert” to stream all CB Analytics, Watchlist, and Device Control alerts to your downstream single-pain-of-glass.

The full alert schema can be found in the Data Forwarder Data Guide.
- Alert Usage Example
-
A MITRE dashboard is a powerful method to summarizing alerts. CB Analytics alerts contain TTPs in the threat_indicators field, such as “
MITRE_T1059_CMD_LINE_OR_SCRIPT_INTER”.Alert data can be aggregated into which endpoints have the most associated MITRE TTPs, or even mapped to the ATT&CK Matrix.
Analytics Alerts
A common UI workflow for CB Analytics alerts is to pivot to the Investigate page to see all related Enriched Events.
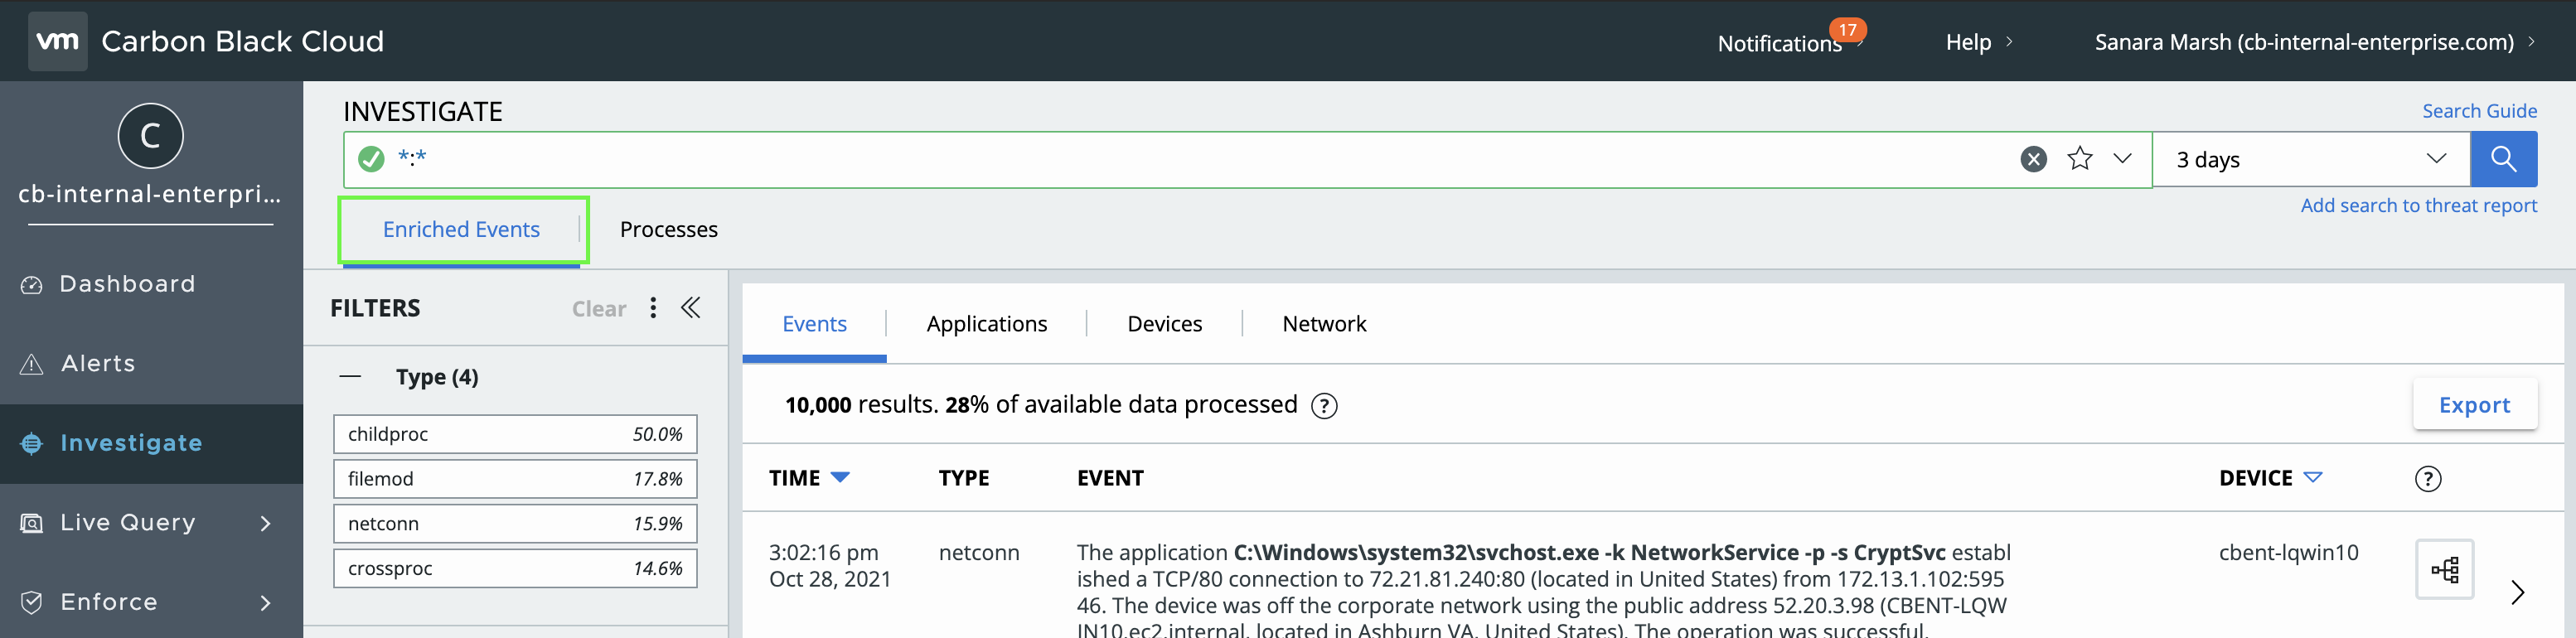
This can be replicated in the Data Forwarder by filtering to any Enriched Event associated with an Alert ID.
- Analytics Alert Filter Example
-
- Correlate Alerts with their Enriched Events on
{Alert}.id = {Event}.alert_id - Identify process cmdlines & usernames related to the alert
{Event}.process_cmdline,{Event}.process_username - Get event-level metadata, such as which files & registry keys were modified as part of the alert
Include: Any event related to CB Analytics Alert, Filter
alert_id:* - Correlate Alerts with their Enriched Events on
Watchlist Alerts
In certain cases, SOC Analysts need event metadata to effectively triage Watchlist Alerts. Start by identifying the most common Watchlist Alerts that analysts routinely spend time pivoting from the single-pane-of-glass back to Carbon Black Cloud.
Use the ioc_hit field from the Watchlist Alert to craft a corresponding Data Forwarder filter.
- Watchlist Alert Filter Example
-
Watchlist: Carbon Black Advanced Threats
Report: Lateral Movement - PowerShell Making Network Connections Over SMB
IOC:(process_name:powershell.exe AND netconn_port:445 AND netconn_count:[1 TO *])The Watchlist alert will tell you which process on which endpoint matched the IOC. But an analyst will probably want to know more details about the network connections, such as the remote IP and whether they were inbound or outbound.
This can be accomplished by adding a corresponding Data Forwarder filter, such as:
process_path:*\\powershell.exe AND remote_port:445Note the slight differences between the Watchlist IOC and Data Forwarder Filter: process_name becomes process_path with a prefixed wildcard and netconn_count is not needed, as the remote_port filter implicitly implies any matching even must be a netconn (remote_port does not currently appear on any other event type).
Then, when triaging the alert, the analyst can pivot from the alert to events (containing the same Process GUID), quickly or automatically identifying the details of every network connection this process made on port 445
SIEM Context
While sending Alerts to a SIEM is a great first step towards enabling your SOC, most SIEMs can take advantage of greater visibility into endpoint telemetry.
Endpoint Visibility & Inventory
Endpoint events, especially procstarts, provide visibility into every process running on the endpoint.
- Report on all endpoints sending data to Carbon Black Cloud
- Identify endpoints that were previously sending data and have stopped
- Build a dashboard on the most common and least common processes.
- Identify endpoints running unauthorized or out of date applications.
- Have visibility into any applications or behavior blocked by Carbon Black Cloud’s NGAV solution
Get started with these filters, then tune and adjust based on the full list of building blocks below or your SOC’s own use cases.
For a primarily Windows deployment, expected volume: 65MB+ per endpoint per day.

|
Filter Type |
Filter Name |
Filter Example |
|
Include |
EDR events for low volume, high value event types |
|
|
Include |
NGAV events for high volume event types |
|
|
Include |
Any event related to a CB Analytics Alert |
|
|
Include |
Blocked or terminated processes |
|
|
Include |
EDR events from high-value device/sensor groups |
|
|
Exclude |
Noisy, known good activity |
|
Network to Endpoint
Netconn events associate inbound and outbound network connections to the process where the traffic originated.
- Investigate suspicious activity from your network tools, such as firewall and proxy, by identifying the originating process. Was this a user visiting the site in a browser (probably normal), or from a PowerShell instance that’s the child of an office product (possible C2).
- Identify processes communicating on non-standard ports
Example filter set: See the recommendations for Endpoint visibility & inventory above.
File Integrity Monitoring
While Carbon Black Cloud was not designed as a FIM solution for compliance, you can achieve FIM-like use cases by monitoring specific directories for unauthorized changes. SANS provides a good starting point on which directories to monitor.
See the Specific Filemod Events building block for an example filter.
Threat Hunting & Incident Response
After a threat has been identified, having all relevant EDR data in the downstream tool is critical to identify the full scope of the incident and how to respond. Full Threat Hunting and IR require unfiltered EDR data. When it’s not feasible to forward all unfiltered data, identify the best signals possible to at least enable your investigation to begin in your downstream tool.
Once you’ve discovered a process that needs follow-up, the Carbon Black Console can still be your source of truth.
Common Threat Actor Techniques
Command interpreters, such as PowerShell, are commonly used by threat actors in living-off-the-land attacks.
- Identify any endpoint running a command interpreter
- Over time, determine what “known good” command interpreter use is for your environment
- For example, a dashboard can show most common parent processes and scripts invoked, which can then be filtered out for better visibility into less common usage
- As command interpreters are commonly used in malware, having this full data set in a SIEM alert triage and investigation use cases and begins to cross into incident response use cases
See the Command Interpreters building block for an example filter.
Data Loss Prevention & Insider Threats
While Carbon Black Cloud is not a DLP solution, endpoint events can help identify which files a user has interacted with. Note that a file must be modified in some way (create, delete, update, etc) to generate a filemod event.
If a network tool detected a large transfer to a common exfiltration site such as dropbox, a netconn event could identify the process that uploaded the data. Was this a browser, sync tool, or suspicious malware file? Then filemod events could pinpoint files the user had recently interacted with, especially if the user had downloaded the file locally from a corporate fileshare or cloud service in order to exfiltrate it.
Build Custom Detections
Baseline detections are supported by many SIEM tools, allowing SOC teams to build a detection based on historical data unique to each endpoint or process. These detections are often akin to a watchlist hit; an anomaly on its own may not be worth investigating, but an endpoint with multiple anomalies is valuable context during an existing investigation or a powerful starting point for threat hunting.
- What processes normally run on a given endpoint?
- What users typically run processes on the endpoint?
- How many processes start each day?
- Does a specific process normally modify files in a system directory?
- Does a specific process normally make network connections?
Log4Shell
The Data Forwarder can forward indicators of the Log4Shell vulnerability (CVE-2021-44228 and CVE-2021-45046) to enable hunting and incident response. You can find TAU’s recommendations for managing Log4Shell with Carbon Black Cloud here and additional information on post-exploit activity here.
Watchlist Hits
Carbon Black Cloud Enterprise EDR customers can now forward alerted & non-alerted watchlist hits. by creating a Data Forwarder of type "watchlist. hit"
Out-of-the-box Watchlists include:
-
Log4Shell-specific activity, such as the threat intelligence from Greynoise and Azure Sentinel in the "Carbon Black Known IOCs" watchlist
-
General post-exploitation activity
Watchlist hit data contains more detailed information about the process than the current alert data, including process_cmdline, process_username, parent_path, and parent_cmdline. That context helps quickly identify if the suspicious activity is from Java or another vulnerable application.
Endpoint Events
-
Filter Label: Any activity matching the known exploit string
-
Example Filter:
process_cmdline:*$*jndi\:* OR parent_cmdline:*$*jndi\:* OR target_cmdline:*$*jndi\:* OR fileless_scriptload_cmdline:*$*jndi\:* -
Use Case: Identify potentially malicious activity in cmdlines, as well as any child processes that may result. This may be the result of an already-compromised system attempting lateral movement
Note: Obfuscation techniques are now being observed in the wild and you may need to adjust this filter accordingly as threat actor techniques evolve. Such filters might include:
-
process_cmdline:*$*j*n*d*i*
-
-
Filter Label: Any activity from the process and their children which reference Log4j
-
Example Filter:
process_cmdline:*log4j* OR parent_cmdline:*log4j* OR target_cmdline:*log4j* -
Use Case: A process with log4j in the cmdline is very likely to be using log4j. The next steps would include identifying if the version of log4j is vulnerable, a list of which can be found here: https://github.com/mubix/CVE-2021-44228-Log4Shell-Hashes/blob/main/sha256sums.txt
-
-
Filter Label: Any filemod or moduleload that references Log4j
-
Example Filter:
filemod_name:*log4j-core-*.jar* -
Use Case: Continue to identify additional applications in your environment that leverage Log4j and require patching. This could also be accomplished using the version in filemod_name and modload_name
-
-
Filter Label: Java spawning Powershell and other command interpreters
-
Example Filter:
(process_path:(*\\java.exe OR *\/java) AND childproc_name:(*powershell* OR *\/bash)) OR (parent_path:(*\\java.exe OR *\/java) AND process_path:(*powershell* OR *\/bash)) -
Use Case: Java has been observed as the main actor in any post-exploitation activity; any command interpret traffic from Java should be monitored closely
Note: Additional command interpreter filter syntax can be found under "Include: Command Interpreters" here: https://carbonblack.vmware.com/resource/getting-started-custom-filters-data-forwarder#building-block...
-
-
Filter Label: Any activity from processes and their children known to use Log4j, such as from our Tech Zone article for Detecting Log4j in the Carbon Black Console
-
Example Filter:
process_path:(*\\java.exe OR *\\ws_tomcatservice.exe OR \/java OR \/linux_process2) OR parent_path:(*\\java.exe OR *\\ws_tomcatservice.exe OR \/java OR \/linux_process2) -
Use Case: Audit all activities of known-vulnerable applications until they have been patched. This is critical for threat hunting and incident response to assess what endpoints have been compromised, what was executed, and what remediation is necessary.
-
Java seems to be the leading parent process of post-exploitation activity
-
VMware’s list of impacted products can be found here: https://www.vmware.com/security/advisories/VMSA-2021-0028.html
-
TAU has published a CB Analytics Alert and Live Query syntax to help identify potentially vulnerable applications: https://community.carbonblack.com/t5/Threat-Research-Docs/Log4Shell-Log4j-Remote-Code-Execution-CVE-...
-
-
-
Filter Label: All network connections
-
Example Filter:
type:endpoint.event.netconn OR type:endpoint.event.netconn_proxy -
Use Case: Trace connections to known or suspected Log4Shell C&C servers back to the process that spawned the activity.
Note:
-
This filter can generate a lot of data, especially on Linux systems.
Additional Exclude filters can be used to filter out netconn events from any known non-vulnerable processes. -
It could also be filtered to specific remote_port for the most commonly exploited protocols of the vulnerability (e.g. LDAP=389,636, RMI=1099, DNS=53), however many exploits in the wild are specifying non-standard ports in the JNDI request.
-
-
Building your Custom Data Filters
The building blocks below are suggested filters and starting points to help you curate the highest value data for your organization. Some of these filters may look familiar, as they were included in the use cases described above in the Approaches section. You can find a complete list of filterable fields in the Data Forwarder Data Guide and syntax tips, such as what characters need to be escaped, in the User Guide.
Stars
The building blocks are rated 1 – 5 stars, taking into account the value of the data, volume of the data, and amount of time you’d need to spend customizing the filter to meet your organization’s needs.
For example, EDR Procstart Events is rated at 5 (*****) stars because it drives very valuable use cases relevant to most customers, sends low volumes of data for Windows endpoints, and requires little-to-no customization.
Specific Filemod Events is rated 2 (**) stars because the use cases are less commonly adopted by customers, those use cases will likely require medium or large amounts of data, and it requires significant customization.
Sizes
The amount of data that will match a filter varies significantly based on what’s running on the endpoint. The guidance for each building block is an average per endpoint across Carbon Black Cloud during October, 2021. Data volumes may change over time as Carbon Black Cloud evolves. EPS = Events per second
|
Size Legend (Average Data Forwarder Event Volume per Endpoint per Day) |
||||
|
XS |
S |
M |
L |
XL |
|
< 1 MB < 0.01 EPS |
1 – 15 MB |
15 – 40 MB 0.1 – 0.5 EPS |
40 – 100 MB 0.5 – 1 EPS |
> 100 MB > 1 EPS |
Building Blocks for your Custom Filters
- Include: Alerted Events (*****)
-
Alerted Events are endpoint events associated with a CB Analytics Alert, enabling effective correlation between the alert & alerted events, similar to clicking the “Investigate” button on an alert from the CBC Console. Additional use cases can be found in the Forward Alerted Events for CB Analytics Alerts section.
Product(s) required: Endpoint Standard
Estimated Daily Volume:
Windows: XS
Mac: XS
Linux: XSExample Filter (Include):
alert_id:* - Include: EDR Procstart Events (*****)
-
Procstart events provide visibility into every process running on every endpoint protected by Carbon Black Cloud, with metadata such as user, cmdline, and parent information. These events also encompass what the Carbon Black Console refers to as “childproc” events.
Additional use cases can be found in the Endpoint visibility & inventory section.
Linux-heavy environments: Due to the high data volume of procstart events on Linux, consider excluding noisy, known good processes.
Product(s) required: Enterprise EDR
Estimated Daily Volume:
Windows: S
Mac: L
Linux: LExample Filter (Include):
event_origin:EDR AND type:endpoint.event.procstart - Include: EDR Netconn & Netconn Proxy Events (*****)
-
Netconn events provide visibility into every successful network connection, including the associated process, domain, IP, and ports.
Investigate suspicious activity from your network tools, such as firewall and proxy, by identifying the originating process. Was this a user visiting the site in a browser (probably normal), or from a Powershell instance that’s the child of an office product (possible C2)? Additional use cases can be found in the Network to Endpoint section.
Linux-heavy environments: due to the high data volume of netconn events on Linux, consider excluding noisy, known good processes or including specific netconn events.
Product(s) required: Enterprise EDR
Estimated Daily Volume:
Windows: M
Mac: L
Linux: LExample Filter (Include):
event_origin:EDR AND type:(endpoint.event.netconn OR endpoint.event.netconn_proxy) - Include: EDR Fileless Scriptload (*****)
-
Fileless scriptloads events are commonly used by threat actors in living-off-the-land attacks and fileless malware. These events include the deobfuscated command executed, enabling the SOC to quickly identify anomalous behavior.
Product(s) required: Endpoint Standard
Estimated Daily Volume:
Windows: S
Mac: N/A
Linux: N/AExample Filter (Include):
event_origin:EDR AND type:endpoint.event.fileless_scriptload - Include: NGAV Regmod (****)
-
Regmod events provide visibility into Windows registry key modifications, such as those used for by threat actors to achieve persistence. NGAV (Behavioral EDR) Regmod events are curated by the TAU team to monitor the registry keys most often associated with malicious behavior.
Product(s) required: Endpoint Standard
Alternative: Specific Regmod Events
Estimated Daily Volume:
Windows: XS
Mac: N/A
Linux: N/AExample Filter (Include):
event_origin:NGAV AND type:endpoint.event.regmod - Include: NGAV Filemod (****)
-
Filemod events provide visibility into any file on the endpoint created, deleted, or modified. NGAV (Behavioral EDR) filemod events are curated by the TAU team to capture suspicious behavior, such as known malware saved to the endpoint or unexpected processes modifying user documents. These events provide the SOC with visibility into an initial malware drop and support alert triage and incident response use cases. SOCs can also leverage these events in conjunction with SOAR; following an event indicating a suspicious file, Live Response could automatically retrieve the file from the endpoint. It can then be sent to a sandbox for further analysis.
Product(s) required: Endpoint Standard
Alternative: Specific Filemod Events
Estimated Daily Volume:
Windows: S
Mac: S
Linux: SExample Filter (Include):
event_origin:NGAV AND type:endpoint.event.filemod - Include: NGAV Crossproc & APICall Events (****)
-
Apicall events and crossproc events provide visibility into cross-process activity, including the target process & API called. This is a common technique used in malware, such as credential scraping of system security processes like lsass.exe. These events provide the SOC with key insights into a commonly used threat technique, while supporting alert triage, threat hunting, and incident response use cases.
The NGAV event stream (Behavioral EDR) distinguishes between crossproc events, when the action is CREATE_REMOTE_THREAD or OPEN_PROCESS_HANDLE and Apicall events, when the action is PROCESS_API_CALL. It also includes the crossproc_api called (such as CreateRemoteThread, CreateProcess, NtReadVirtualMemory)
APICall events are being introduced to the EDR event stream in Windows sensor version 3.8.
Product(s) required: Endpoint Standard
Alternative: Include: Unsigned Moduleload, Scriptload, and Crossproc Events
Estimated Daily Volume:
Windows: S
Mac: XS
Linux: N/AExample Filter (Include):
event_origin:NGAV AND type:(endpoint.event.apicall OR endpoint.event.crossproc) - Include: NGAV Moduleload (****)
-
Moduleload events provide visibility into when a process loads a shared library into its process memory space. NGAV (Behavioral EDR) moduleload events capture commonly abused modules, such as script interpreters, and are currently only supported on Windows. These events provide the SOC with key insight into a commonly used threat techniques, while supporting alert triage, threat hunting, and incident response use cases.
Product(s) required: Endpoint Standard
Alternative: Include: Unsigned Moduleload, Scriptload, and Crossproc Events
Estimated Daily Volume:
Windows: XS
Mac: N/A
Linux: N/AExample Filter (Include):
event_origin:NGAV AND type:endpoint.event.moduleload - Include: Scriptload (****)
-
Scriptload events provide visibility into when a process loads a script (.ps1, .vb, .bin, etc..) that can be executed by a script interpreter. This provides the SOC with key insights into a commonly used threat techniques, while supporting alert triage, threat hunting, and incident response use cases.
Customers with Endpoint Standard can consider also including NGAV (Behavioral EDR) scriptload events, which capture scripts matching known malware and other suspicious content. These events have the added benefit of including the scriptload content and the event description to explain what Carbon Black Cloud knows about the script. Due to the inclusion of the scriptload content, data volume may be less predicable if the content length is large.
Product(s) required: Any
Alternative: Include: Unsigned Moduleload, Scriptload, and Crossproc Events
Linux-heavy environments: Due to the high data volume of scriptload events on Linux, consider excluding noisy, known good processes or scripts.
Estimated Daily Volume:
Windows: S
Mac: XS
Linux: XLExample Filter (Include):
type:endpoint.event.scriptload - Include: Stolen Certificates (***)
-
Recent data breaches have resulted in the theft of signing certificates, which are then used to sign malware and escape traditional detections. Including all process activity provides visibility into processes and drivers using the potentially compromised certificate.
To help limit data volume, legitimate processes signed by the stolen certificate can be excluded by process hash.
Product(s) required: Enterprise EDR
Example Filter (Include):
process_publisher:"NVIDIA Corporation" OR crossproc_publisher:"NVIDIA Corporation" OR modload_publisher:"NVIDIA Corporation" OR childproc_publisher:"NVIDIA Corporation" OR scriptload_publisher:"NVIDIA Corporation"
Example Filter (Exclude):
process_hash:(04b86108fc74650cda5739dd41ce37a57614cefc8916c79141b228834f7e8f91 OR 742ef2c4f285cdefcdf639a16f9eca9b3561cb6022fe42db8943b0dda66dc66e)
- Exclude: Known Good Processes (***)
-
Noisy processes sometimes account for a sizeable amount of data volume. While excluding these processes can increase the risk of losing visibility into living-off-the-land attacks, that risk can be mitigated by:
Leveraging the Watchlist framework to detect generally suspicious behavior from all processes, including those filtered out of the Data Forwarder. Constructing the filter to be as specific as possible. Consider: if an insider threat had visibility into your filters, how could they bypass them?
- Avoid excluding processes from an entire directory, as malware in that directory could be easily missed
- Combine process criteria with event type or other event attributes; if the process is generating a significant volume of data loading a specific module, just exclude that process & module name combination.
- For processes that don’t often change, consider using the process hash.
- On Windows platforms, use a combination of the full process path and publisher name & state.
Product(s) required: Any
Example Filters (Exclude):
process_path:C\:\\Program\ Files\\Contoso\\ContosoApp.exe AND process_publisher_name:"Contoso Inc" AND process_publisher_state:FILE_SIGNATURE_STATE_SIGNED.process_path:\/usr\/bin\/dpkg AND type:endpoint.event.filemod AND filemod_name:\/usr\/bin\/*.dpkg\-new
- Include: Command Interpreters (***)
-
Command Interpreters (such as powershell, cmd, cscript, terminal, etc) are commonly used in living off the land attacks. Having a full audit trail of every time a command interpreter is invoked, its activity, and all child processes has many benefits:
- Alert Triage: Quickly triage alerts related to command interpret activity. Visibility and Detections: Understand what normal vs anomalous command interpreter usage looks like in your environment.
- Consider factors such as the parent process, if and to where the process makes network connections, and any process injection.
- Threat hunting based on prevalence: Look for the least common occurrences based on process, command line, or parent information.
Example Filters (Include), with Parent:
event_origin:EDR AND (process_path:(*\\pwsh.exe OR *\\cmd.exe OR *\\powershell.exe OR *\\cscript.exe OR *\\wscript.exe OR *\\wmic.exe OR *\\mshta.exe OR *\/sh OR *\/zsh OR *\/csh OR *\/bash OR *\/tcsh OR *?python*) OR childproc_name:(*\\pwsh.exe OR *\\cmd.exe OR *\\powershell.exe OR *\\cscript.exe OR *\\wscript.exe OR *\\wmic.exe OR *\\mshta.exe OR *\/sh OR *\/zsh OR *\/csh OR *\/bash OR *\/tcsh OR *?python*) OR parent_path:(*\\pwsh.exe OR *\\cmd.exe OR *\\powershell.exe OR *\\cscript.exe OR *\\wscript.exe OR *\\wmic.exe OR *\\mshta.exe OR *\/sh OR *\/zsh OR *\/csh OR *\/bash OR *\/tcsh OR *?python*))
Ideally, include events from any process whose parent was a command interpreter as well. This ensures that you capture activity from any process the attack may have spawned. However, this also drives a significant amount of additional data volume, especially in Linux. Customers on a tight data budget may consider removing the
parent_pathfrom the example filter as demonstrated below.Product(s) required: Enterprise EDR
Estimated Daily Volume, with Parent:
Windows: L
Mac: L
Linux: XLExample Filters (Include), without Parent:
event_origin:EDR AND (process_path:(*\\pwsh.exe OR *\\cmd.exe OR *\\powershell.exe OR *\\cscript.exe OR *\\wscript.exe OR *\\wmic.exe OR *\\mshta.exe OR *\/sh OR *\/zsh OR *\/csh OR *\/bash OR *\/tcsh OR *?python*) OR childproc_name:(*\\pwsh.exe OR *\\cmd.exe OR *\\powershell.exe OR *\\cscript.exe OR *\\wscript.exe OR *\\wmic.exe OR *\\mshta.exe OR *\/sh OR *\/zsh OR *\/csh OR *\/bash OR *\/tcsh OR *?python*))
Estimated Daily Volume, without Parent:
Windows: M
Mac: M
Linux: M - Include: Critical Assets (***)
-
Some endpoints in your environment warrant additional visibility.
- Visibility and Incident Response: Forwarding all activity from assets such as production servers, domain controllers, honeypots, and C-level/admin endpoints enables the SOC to keep a closer watch on any asset where compromise would have high impact.
- Compliance: Endpoints subject to PCI, such as point-of-sale devices, HIPPA, or other compliance may mandate additional EDR visibility for downstream reporting.
- Staging Forwarder Endpoints: Many customers maintain additional “staging” Data Forwarders for testing new filters and tuning existing filters. This is often accomplished by testing on just a subset of canonical endpoints. The most effective implementation is to configure the additional Forwarder with an Exclude filter that removes events from devices not in the test set.
(In Staging Forwarder) Exclude: Events from any endpoint not in the staging set
NOT device_id:(873264 OR 97386 OR 328721)
Assets can be filtered with
device_group,device_id, ordevice_name; future improvements to Asset Groups may introduce additional group capabilities, such as membership to multiple groups.In some organizations, it is best practice to limit the visibility of lower tier SOC analysts in a SIEM. This can be accomplished by forwarding the events from these critical assets to an alternative destination, such as a different S3 bucket. The SIEM could then ingest these events with different permissions, such as only tier 3+ analyst access.
Product(s) required: Any
Example Filters:
Include: All events from C-Level Laptops, Prod servers, and Domain Controllers
device_id:(983274 OR 123987 OR 786344 OR 973826) OR device_name:prod\-svr\-* OR device_group:Domain\ Controllers
-
Include: Filemod Create (***)
-
Many SOCs find filemod create events to be the most useful subset of filemod events. The percentage of filemod events with
ACTION_FILE_CREATEvaries significantly by environment and OS, but is roughly 20-30% on average across Carbon Black Cloud.- Incident Response: Identify how and when malware first originated on the endpoint, including what process created the file.
- DLP: What files has a user downloaded or transferred on to their endpoint?
Product(s) Required: Enterprise EDR
Example Filters (Include):
event_origin:EDR AND type:endpoint.event.filemod AND action:ACTION_FILE_CREATE
- Include: Processes from Temp directories (**)
-
In most organizations, normal processes don’t run from temporary directories. Auditing and investigating processes running from temporary directories can be a good start to threat hunting.
The example filter below can be combined with event types, such as auditing just netconn and scriptload events for processes running from temp directories.
Estimated Daily Volume:
Windows: M
Mac: S
Linux: XSExample Filters (Include):
process_path:(*\/temp\/* OR *\\temp\\* OR *\\appdata\\*) OR childproc_name:(*\/temp\/* OR *\\temp\\* OR *\\appdata\\*) OR parent_path:(*\/temp\/* OR *\\temp\\* OR *\\appdata\\*)
- Include: Specific Regmod Events (**)
-
Regmod events provide visibility into Windows registry key modifications, such as those used for by threat actors to achieve persistence. You can specify registry keys commonly used for persistence or in ransomware, such as the desktop background. VMware Carbon Black partner Red Canary has a few recommendations in their Windows Registry attacks: Knowledge is the best defense blog.
Product(s) required: Enterprise EDR
Alternative: NGAV Regmod Events
Example Filter (Include):
event_origin:EDR AND type:endpoint.event.regmod AND regmod_name:*\\Software\\Microsoft\\Windows\\CurrentVersion\\Run*
- Include: Specific Filemod Events (**)
-
Filemod events provide visibility into any file on the endpoint created, deleted, or modified. Filemod events can create significant event volume, so specifying certain criteria such as the file path, extension, and action that meets your SOC detection & response use cases can effectively reduce this volume.
- File Integrity Monitoring: Monitor critical system directories for changes. SANS provides a good starting point for which directories to monitor.
- Persistence: Certain directories, such as the Windows Startup folder or Linux cron, are used by threat actors to gain persistence on the endpoint.
- Ransomware: Modifications of common user files, especially from unknown or unsigned processes, can help detect and respond to ransomware.
- Backups and restorations: End-users sometimes make mistakes, such as accidentally deleting thousands of files. Having an audit trail of every file path deleted can accelerate restoration.
Product(s) required: Enterprise EDR
Alternatives: Include: NGAV Filemod, Include: Filemod CreateExample Filters:
Exclude: Filemod events on noisy Mac and Linux directoriesdevice_os:(MAC OR LINUX) AND filemod_name:(\/etc\/mtab* OR \/etc\/hosts.deny*)
Exclude: Filemod events on noisy Windows directories
device_os:WINDOWS AND filemod_name:(c\:\\windows\\system32\\logfiles* OR c\:\\windows\\debug*)
Include: Filemod events on important Mac and Linux directories
event_origin:EDR AND device_os:(MAC OR LINUX) AND filemod_name:(*\/etc\/* OR *\/boot\/* OR *\/bin\/* OR *\/sbin\/* OR *\/opt\/*)
Include: Filemod events on important Windows directories
event_origin:EDR AND device_os:WINDOWS AND filemod_name:(c\:\\windows\\* OR *startup*)
- Include: Specific Netconn Events (**)
-
While netconn events can be powerful conduits between endpoint and network data sources, the data volume may still be too expensive, especially on Linux systems. Being more specific about the processes, internal vs external connections, and protocol can vastly reduce the volume.
- High risk protocols: SSH, SMB, RDP are commonly used in remote access or the spread of malware between systems.
- Expected network traffic: Excluding normal network operation based on the expected behavior of the application, such as port 443 & 80 for browsers.
- High volume network traffic: If you have a network tool that captures connection data already, you can do targeted exclude filters. For example, in Linux,
namedis a significant driver of internal network connections on port 53 (DNS).
Example Filters:
Exclude: Netconn events between internal IPs on port 53 from
namedon Linuxdevice_os:LINUX AND process_path:named AND remote_ip:(10.0.0.0\/8 OR 172.16.0.0\/12 OR 192.168.0.0\/16) AND local_ip:(10.0.0.0\/8 OR 172.16.0.0\/12 OR 192.168.0.0\/16) AND (remote_port:53 OR local_port:53)
Include: Netconn events from critical protocols (SSH, SMB, RDP)
local_port:(22 OR 139 OR 445 OR 3389) OR remote_port:(22 OR 139 OR 445 OR 3389) or netconn_proxy_port:( 22 OR 139 OR 445 OR 3389)
Exclude: Netconn events on ports 80 and 443 from common Windows browsers
device_os:WINDOWS AND ((process_path:*\\google\\chrome\\application\\chrome.exe AND process_publisher:Google\ LLC AND process_publisher_state:FILE_SIGNATURE_STATE_SIGNED) OR (process_path:*\\mozilla\ firefox\\firefox.exe AND process_publisher:Mozilla\ Corporation AND process_publisher_state:FILE_SIGNATURE_STATE_SIGNED)) AND remote_port:(443 OR 80) AND netconn_inbound:false
Exclude: Netconn events on ports 80 and 443 from common Mac browsers
device_os:MAC AND (process_path:\/Applications\/Google\ Chrome.app\/Contents\/MacOS\/Google\ Chrome OR process_path:\/Applications\/Google\ Chrome.app\/Contents\/Frameworks\/Google\ Chrome\ Framework.framework\/Versions\/*\/Helpers\/Google\ Chrome\ Helper.app\/Contents\/MacOS\/Google\ Chrome\ Helper) AND remote_port:(443 OR 80) AND netconn_inbound:false
- Include: Unsigned Moduleload, Scriptload, and Crossproc Events (*)
-
Moduleload, scriptload, and crossproc events are an important piece of threat hunting and incident response. Malware does invoke signed & trusted DLLs, scripts, and processes, but this often has a poor signal to noise ratio. A record of all unsigned invocation activity is valuable for threat hunting purposes. You may want to further refine these filters to exclude known-good, unsigned invocations.
Example Filters:
Include: Unsigned Moduleload Eventstype:endpoint.event.moduleload AND modload_publisher_state:FILE_SIGNATURE_STATE_NOT_SIGNEDInclude: Unsigned Scriptload Events
type:endpoint.event.scriptload AND scriptload_publisher_state:FILE_SIGNATURE_STATE_NOT_SIGNEDInclude: Unsigned Crossproc Events
type:endpoint.event.crossproc AND crossproc_publisher_state:FILE_SIGNATURE_STATE_NOT_SIGNED
Summary and Additional Resources
Carbon Black Cloud now has powerful filtering capabilities, putting you in control of the data your organization finds most valuable, while meeting your team’s data budget. This guide is a framework to help identify the most valuable use cases to your organization and the filters that can drive them. The content is primarily targeted at customers with Enterprise EDR enabled.
Authors and Contributors
Bruce Deakyne is a Product Line Manager at VMware Carbon Black Cloud, focused on improving the ecosystem of APIs & integrations. Outside of cyber security, he enjoys cycling through the mountains of Boulder, CO.
Additional Resources
For more information, you can explore the following resources:
- General Data Forwarder documentation
- Using the Data Forwarder with Splunk
Change Log
The following updates were made to this guide:
|
Date |
Description of Changes |
|
2021-11-11 |
|
| 2021-12-17 |
|
| 2022-03-09 |
|
| 2022-03-28 |
|
| 2022-05-24 |
|
| 2023-01-03 |
|
Feedback
Your feedback is valuable.
To comment on this paper, contact VMware Security Business Unit Technical Marketing at SBU_tech_content_feedback@vmware.com.