
Best Practices: Carbon Black Cloud Audit and Remediation
Introduction
VMware Carbon Black Audit and Remediation is a real-time assessment and remediation solution that gives teams faster, easier access to audit and change the system state of endpoints across their organization. VMware Carbon Black Audit and Remediation is built on top of the open-source project osquery (https://osquery.io), which was originally started by Facebook.
This guide will provide a set of best practices for constructing, and running queries in your organization. This guide assumes that you have a basic familiarity with VMware Carbon Black Audit and Remediation and the SQLite syntax.
osquery
Since VMware Carbon Black Audit and Remediation is built on top of osquery (which is built on top of SQLite) it only makes sense to leverage it to our advantage. It is immensely helpful to directly access osquery on an endpoint to construct and test queries. By doing so, you get immediate feedback on your query without having to wait for the sensor to check back in. Warning messages are also shown when accessing osquery directly, that are not shown in VMware Carbon Black Audit and Remediation.
This section will walk you through the installation process.
osquery version
Before getting started with installing osquery, you need to determine what version of osquery the current version of your sensor(s) is/are running. The version is important because new tables are getting added all the time, so you will need this information to ensure you are looking at the correct schema. It should be noted that different operating system (Windows, MacOS, Linux) can have different versions of osquery even if they are all running the latest sensor version. You can find this information in release notes, but it is probably easier to use Live Response to get the information from the endpoint itself.
Open a Live query session and run the following commands denoted by OS:
- Windows: execfg "\program files\confer\blades\livequery\osqueryi.exe" --version
- MacOS: Not supported. The version would need to be obtained from release notes.
- Linux: execfg /opt/carbonblack/psc/blades/40E797FD-4322-4D33-8E8C-EF697F4C2323/osqueryi --version
- Or consult this page on the user exchange: https://community.carbonblack.com/t5/Audit-and-Remediation-Documents/Carbon-Black-Cloud-Sensor-Support-for-osquery/ta-p/82901
osquery schema
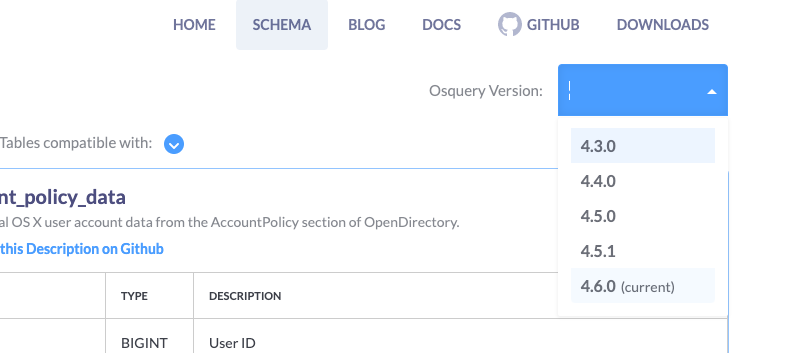
Once you have the correct osquery version, you can take a look at the appropriate schema page (https://osquery.io/schema). When you initially arrive at the schema page you will be view the latest schema. Use the Osquery Version: drop-down (top right) to select the appropriate version:
Once you have the appropriate schema displayed you can filter the tables to the specific OS you are interested in with the Tables compatible with: drop-down. The only tables not supported in VMware Carbon Black Audit and Remediation are the evented tables:

It should be noted that the carbon_black_info table is not designed for VMware Carbon Black Cloud Sensors. This table is designed for the VMware Carbon Black EDR (formerly Carbon Black Response) sensors.
Installing osquery
In the past, you could leverage the osquery version that the VMware Carbon Black sensor installed on the endpoint, but this is no longer the case as it is now a protected process. We were able to leverage it before because the Live response session runs as SYSTEM on Windows and root on Linux, but Live Response does not support interactive shells.
To get around these issues, we will be installing osquery on the endpoint(s) we are going to be using to test our queries. Navigate to the downloads page (https://osquery.io/downloads/official), select the correct version with the Osquery Version:
drop-down, and then select the appropriate OS. The installation process is pretty straightforward, so it will not be covered here.
Once osquery is installed, you can open the interactive shell by accessing osqueryi. On Linux and macOS this binary should be in your path, so you can just execute:
$: sudo osqueryi
osqueryi is being executed with sudo because there are tables that need root privileges to access certain data.
On Windows, it will be installed in \Program Files\osquery and you can enter thinteractive shell by entering the following at an administrator command prompt:
C:\Windows\system32>"\Program Files\osquery\osqueryi"
The Interactive Shell
Once in the shell, you can access the help menu by typing .help. All non-SQLite commands are preceded by a period, or dot and are not followed by a semicolon like SQLite commands. Here is a sample of what you’d see:
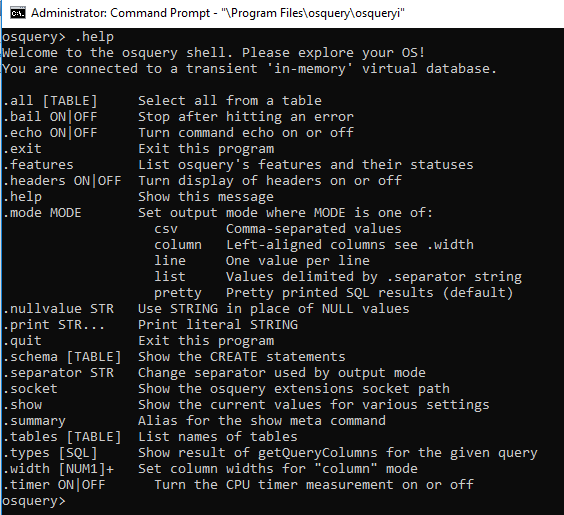
Out of all of these functions, I have found the following useful:
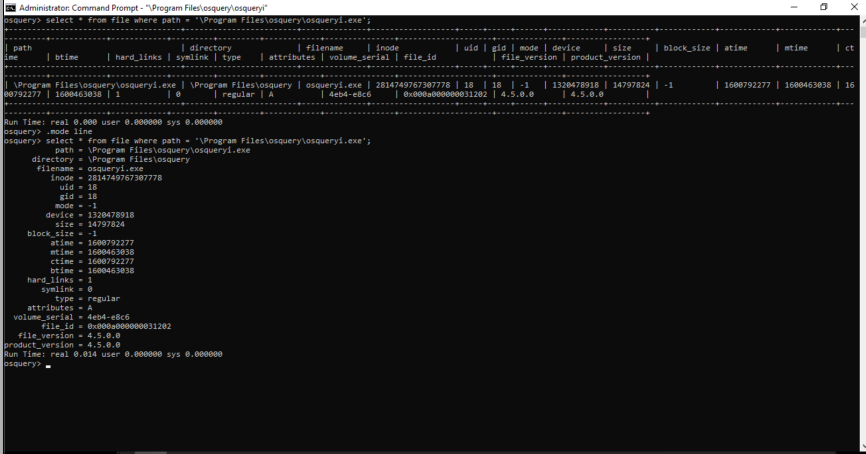
- .mode line. This is helpful when the result set has a lot of columns that may wrap and make things hard to read
- .schema. This command is helpful when trying to remember what columns are in a table
- .timer.This command will output the time it took for a query to run, which is very helpful when testing queries
osquery command history
You can retrieve previous SQLite commands you typed by hitting the up arrow in the interactive shell.
You can search through your command history by hitting Ctrl + R and entering your search terms. To select and run the current search hit Enter, to select it for editing hit the right arrow, and to escape from the search hit Ctrl + G.
Tab completion
You can complete the names of tables by hitting a tab with enough characters entered to make it unique. You cannot tab-complete column names.
Limitations
Queries are limited to maximum memory usage of 500MB. The query is terminated if the query's memory usage exceeds 500MB.
The resulting query payload is limited to the maximum size of 1MB. Query results exceeding 1MB are truncated without warning.
The user interface limits the results to 10,000. To see the full results, use the Export button or use the Live Query API. https://developer.carbonblack.com/reference/carbon-black-cloud/cb-liveops/latest/livequery-api/
Queries that take over 900 seconds are terminated.
Osquery Tables
This section will cover the idiosyncrasies with some of the osquery tables.
Tables that require a WHERE clause
While this is not an exhaustive list, it will give you an idea of the types of tables that require a WHERE clause. If you run one of the tables without the WHERE clause you will get an error like this:
![]()
Some of the most commonly used tables that require a WHERE clause are:
- registry (key, or path)
- hash (path)
- file (path)
- yara (path, and one of the following: sig_group, sigfile, sigrule, or sigurl)
- windows_eventlog (channel)
Registry
Any value in the standard registry hives can be queried except for HKEY_CURRENT_USER. As noted above there is a required WHERE clause to run this query. Instead, user information can be obtained by querying HKEY_USERS. When querying this hive you must provide the user's SID in the query, or substitute it with a wildcard for all users:
select * from registry where path = 'HKEY_USERS\ S-1-5-21-773217070-3718577480-650418937-1001\Software\7-Zip';
select * from registry where path like 'HKEY_USERS\%\Software\7-Zip';
Augeas
Please don’t ask me how to pronounce this table, but it is a pretty powerful one. This table enables you to search through standard config files on Linux and macOS. Here is a side by side view of the ssh_config file.

When there is just one key value pairs seen in A, B, and C these are represented as such in the table. If there are multiple keys of the same name, or a key has multiple values, it will be represented in an array as shown in D.
File
This table (and many others) has file time stamps that are in unix epoch time and need to be converted to be human readable. For this conversion we will use the DATETIME() SQLite function. Here it is without the conversion:

And with:

If you want the timestamp in UTC omit the ,‘localtime’.
Windows_eventlog
select * from windows_eventlog

where channel = 'Security'

  and eventid = '4624';

       channel = Security

     datetime = 2021-08-30T17:28:37.336922000Z

         task = 12544

        level = 0

provider_name = Microsoft-Windows-Security-Auditing

provider_guid = {54849625-5478-4994-A5BA-3E3B0328C30D}

      eventid = 4624

     keywords = 0x8020000000000000

         data = {"EventData":{"SubjectUserSid":"S-1-5-18","SubjectUserName":"MHRA6LITBK$","SubjectDomainName":"WORKGROUP","SubjectLogonId":"0x3e7","TargetUserSid":"S-1-5-18","TargetUserName":"SYSTEM","TargetDomainName":"NT AUTHORITY","TargetLogonId":"0x3e7","LogonType":"5","LogonProcessName":"Advapi  ","AuthenticationPackageName":"Negotiate","WorkstationName":"-","LogonGuid":"{00000000-0000-0000-0000-000000000000}","TransmittedServices":"-","LmPackageName":"-","KeyLength":"0","ProcessId":"0x280","ProcessName":"C:\\Windows\\System32\\services.exe","IpAddress":"-","IpPort":"-","ImpersonationLevel":"%%1833","RestrictedAdminMode":"-","TargetOutboundUserName":"-","TargetOutboundDomainName":"-","VirtualAccount":"%%1843","TargetLinkedLogonId":"0x0","ElevatedToken":"%%1842"}}

          pid = 676

          tid = 6500
This table requires the use of the channel or xpath columns in the WHERE clause. The channel column is case sensitive and refers to the log source, for example, one of the main Windows Event Logs:
- Application
- Security
- Setup
- System
Some of the results are in individual columns such as eventid, but all of the log data is available in a JSON blob in the data column. The JSON_EXTRACT() function can be used to pull data from, or do comparisons to, the data in the JSON blob. Here is what the log data looks like:
Here is an example of using JSON_EXTRACT() to display a value, and use it to make a comparison on a specific value in the JSON blob:
select datetime,eventid,

  json_extract(data,"$.EventData.SubjectUserName") as SubjectUserName,

  json_extract(data,'$.EventData.LogonType') as LogonType

from windows_eventlog

where channel = 'Security'

  and eventid = '4624'

  and json_extract(data,'$.EventData.LogonType') = '5';

  datetime = 2021-08-30T17:28:37.336922000Z

  eventid = 4624

SubjectUserName = MHRA6LITBK$

      LogonType = 5
There are also many other types of Windows Event Logs that can be queried as seen here under Applications and Service Logs:

The value for channel is the Log Name seen in the center pane. AirWatch above, and Microsoft-Windows-GroupPolicy/Operational for the one below:

If you currently have custom views in Event Viewer you can use those directly in a query by copying the data from the XML tab of the Custom View Properties page:

The resultant query would look like

Constructing Queries
Now that you have a good understanding of osquery you can start constructing queries of your own using the interactive shell. By using the shell you can get immediate feedback on your queries which enables you to troubleshoot them more efficiently, ensure the output meets your needs, and see how long the query takes to run.
The Interactive Shell
For use of the shell please refer to the previous section on this topic.
Column Selection
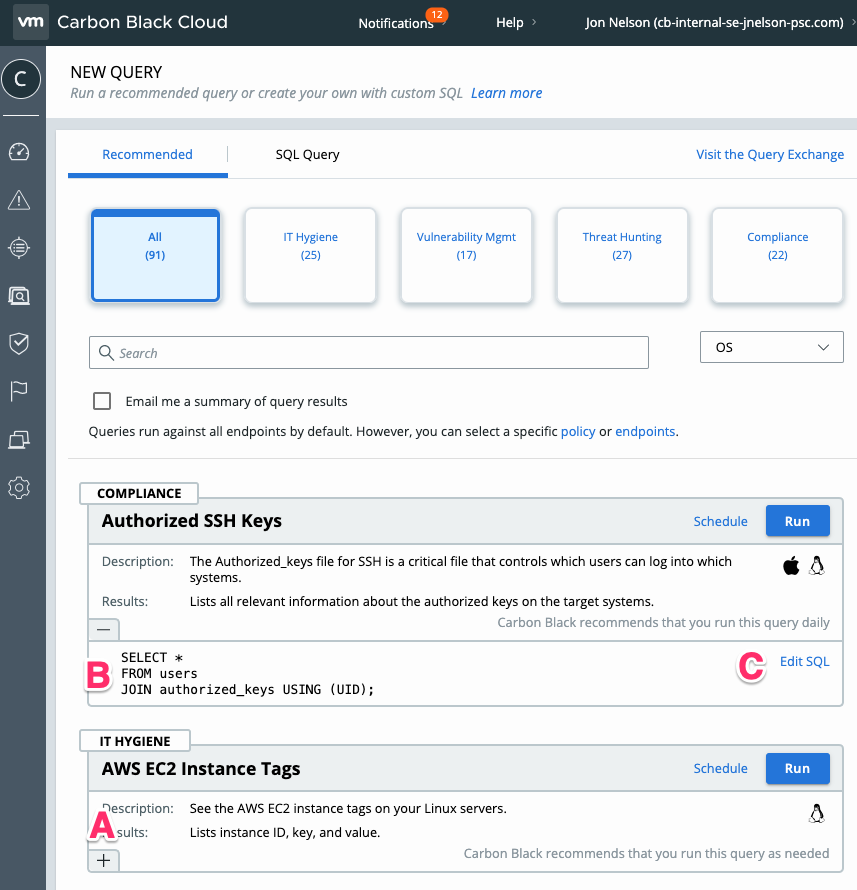
While you can easily use a simple SELECT * to return all of the columns for a give table, it is not practical for many tables. Once you have chosen the columns that you want in your results, and use the query in VMware Carbon Black Audit and Remediation (A), those columns will appear in the UI (B) and in the facets (C) for filtering:

Notice that columns and facets are displayed in alphabetical order. There is not currently a way to change this behavior.
SQLite Tutorial
My favorite resource for learning more about SQLite is this web page: https://www.sqlitetutorial.net/. If you are new to SQLite then here are the statements and functions you should focus on:
Example Queries
Within the VMware Carbon Black Audit and Remediation UI on the New Query tab there are Recommended queries that are constantly being added and improved.
Not only can you run these queries, but you can edit them for your own unique needs. Click on the + (A) to expose the SQLite (B) and the Edit SQL link. Click this link to edit and run the queriy.
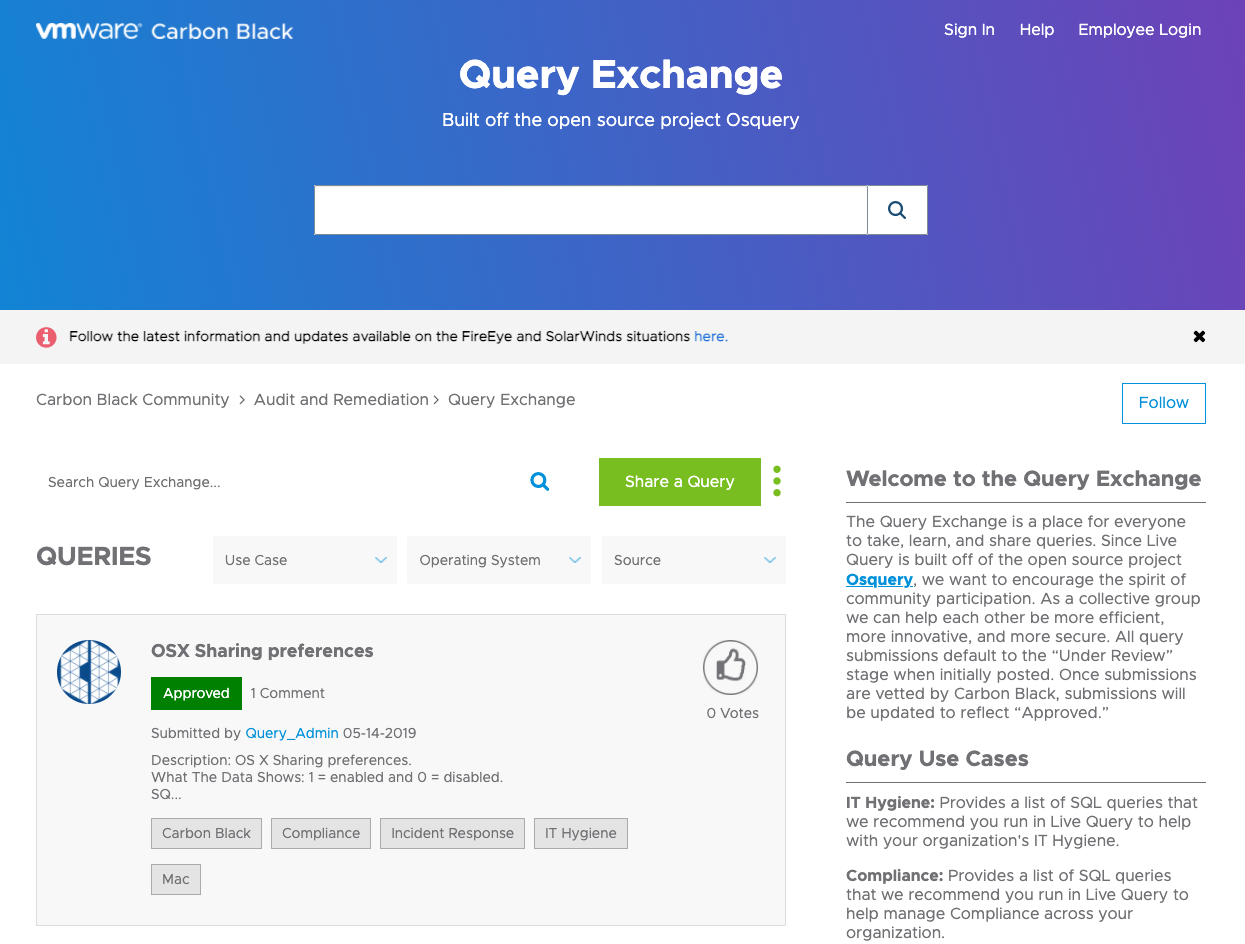
Example queries are also available at the Query Exchange (https://community.carbonblack.com/t5/Query-Exchange/idb-p/query_exchange) where we currently have ~150 queries for you to choose from. The queries are contributed by VMware employees, customers, or the open-source community as it is open to the public.
Summary and Additional Resources
Additional Resources
- Leveling Up with osquery for Workloads: Identifying and Contextualizing Windows Logon Failures - Part 1
- Leveling Up with osquery for Workloads: Locating local administrator accounts (windows) - Part 2
- Leveling Up with osquery for Workloads: Identifying Bitlocker Misconfigurations At Scale
Changelog
The following updates were made to this guide:
|
Date |
Description of Changes |
|
2021/03/04 |
|
About the Author and Contributors
Jon is a seasoned computer security professional with over 25 years of experience. He has worked for VMware Carbon Black for 5 years in New York City and the San Francisco Bay Area focusing on large enterprise accounts and security strategy as a Principal Solution Engineer. Jon had come from RSA where he was a Senior Security Systems Engineer in a pre-sales role whose clients included the top tier financial and pharmaceuticals in the New York Metro area.
Feedback
Your feedback is valuable.
To comment on this paper, contact VMware Security Business Unit Technical Marketing at sbu_tech_content_feedback@vmware.com.